Importaciones y exportaciones europeas hasta 2010
DG Agri
17-mar-2011 (hace 14 años 18 días)
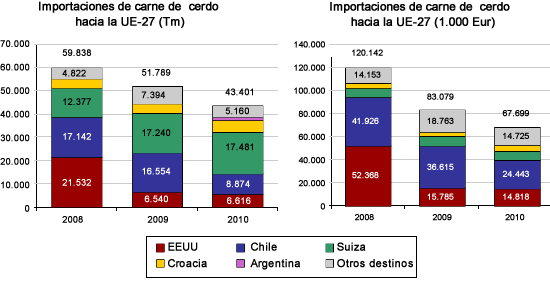
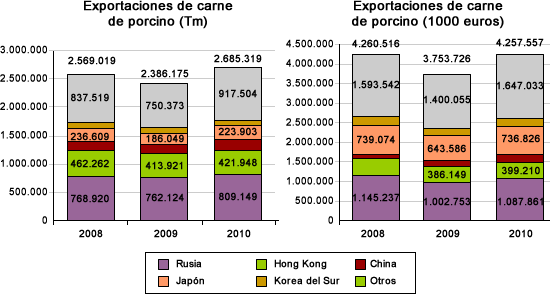
Presentamos datos del DG Agri sobre las importaciones y exportaciones europeas hasta 2010.
Tabla 1. Importaciones europeas de carne porcina
| Origen | 2006 | 2007 | 2008 | 2009 | 2010 |
Comparación con 2009 |
|||||
| Tm | % | Tm | % | Tm | % | Tm | % | Tm | % | ||
| Suiza | 8.934 | 28 | 10.476 | 24 | 12.377 | 21 | 17.240 | 33 | 17.481 | 40% | 1 % |
| Chile | 7.568 | 23 | 12.323 | 29 | 17.142 | 29 | 16.557 | 32 | 8.874 | 20% | -46 % |
| EEUU | 5.380 | 17 | 9.065 | 21 | 21.532 | 36 | 6.416 | 12 | 5.616 | 13% | -14 % |
| Croacia | 3930 | 12 | 2863 | 7 | 3965 | 7 | 4061 | 8 | 5250 | 12% | 29 % |
| Serbia | 523 | 2 | 1.217 | 3 | 1.181 | 2 | 387 | 1 | 851 | 2% | 120 % |
| Canadá | 252 | 1 | 2.660 | 6 | 53 | 0 | 340 | 1 | 414 | 1% | 22 % |
| Otros | 5781 | 18 | 4576 | 11 | 3588 | 6 | 6661 | 13 | 4916 | 11% | |
| Extra UE 25/27 | 32.368 | 43.179 | 59.838 | 51.662 | 43.401 | ||||||
| % cambio | +33% | +39% | -14% | -16,2% | |||||||

Tabla 2. Exportaciones europeas de carne porcina
| Destino | 2006 | 2007 | 2008 | 2009 | 2010 |
Comp. con 2009 |
|||||
| Tm | % | Tm | % | Tm | % | Tm | % | Tm | % | ||
| Rúsia | 687.402 | 32,9 | 647.052 | 33,9 | 769.044 | 29,9 | 760.880 | 31,9 | 809.149 | 30,1 | 6 % |
| Hong Kong | 138.554 | 6,6 | 243.171 | 12,7 | 462.299 | 18,0 | 413.548 | 17,3 | 421.948 | 15,7 | 2 % |
| Japón | 249.380 | 11,9 | 232.951 | 12,2 | 236.609 | 9,2 | 186.134 | 7,8 | 223.903 | 8.3 | 20 % |
| China | 53.785 | 2,6 | 86.345 | 4,5 | 147.951 | 5,8 | 178.725 | 7.5 | 212.020 | 7,9 | 19 % |
| Ucrania | 9.789 | 0,5 | 2.757 | 0,1 | 189.001 | 7,4 | 147.030 | 6,2 | 137.882 | 5,1 | -6 % |
| Corea del Sur | 142.599 | 6,8 | 137.421 | 7,2 | 115.757 | 4,5 | 95.163 | 4,0 | 100.796 | 3,8 | 6 % |
| Filipinas | 23.321 | 1,1 | 34.243 | 1,8 | 40.912 | 1,6 | 26.572 | 1,1 | 89.388 | 3,3 | 0 % |
| Bielorúsia | 59.586 | 2,9 | 10.509 | 0,5 | 55.276 | 2,2 | 28.369 | 1,2 | 80.284 | 3 | 182 % |
| Croacia | 56.785 | 2,7 | 56.151 | 2,9 | 63.426 | 2,5 | 70.697 | 3,0 | 67.581 | 2,5 | -4 % |
| EEUU | 67.048 | 3,2 | 66.472 | 3,5 | 61.471 | 2,4 | 55.495 | 2,3 | 58.627 | 2,2 | 6 % |
| Australia | 29.579 | 1,4 | 34.583 | 1,8 | 45.621 | 1,8 | 46.703 | 2,0 | 50.310 | 1,9 | 8 % |
| Angola | 40.757 | 2,0 | 48.637 | 2,5 | 49.003 | 1,9 | 45.424 | 1,9 | 44.501 | 1,7 | -2 % |
| Otros | 530.778 | 25,4 | 310.615 | 16,3 | 332.719 | 13,0 | 329.795 | 13,8 | 388.931 | 14,5 | |
| Extra UE 25/27 | 2.089.363 | 1.910.908 | 2.569.087 | 2.384.536 | 2.685.319 | ||||||
| % cambio | -9 % | 34 % | -7 % | 12,5 % | |||||||

